How to analyze the real estate market with Zillow Data Exporter

Image of of a sale sign in a store window
Table of contents
- Introduction
- No way but up for the real estate market
- How to analyze the real estate market with Zillow Data Exporter
- Conclusion
Introduction
Have you ever wondered who you can trust when it comes to the real estate market?
The answer is simple: you can trust Zillow.
But a better question is who you should not trust.
Everybody has a bias but most people do not recognize it. Take a real estate agent for example.
A real estate agent has to convince you, a potential buyer, to buy a property.
But what does it take to convince you? You need to be reassured that the real estate market is hot and that the property you are looking at is a good investment.
The only way to know if it is a good investment is if you can resale it for a higher price. In good times, it is not hard to convince buyers to bid higher and higher because there is just no inventory on the market.
In the bad times, the real estate agent has to work harder to convince you that the market may not be at its best currently but that things will turn around soon enough.
No way but up for the real estate market
Since you are not a real estate agent nor are you a broker then you need to find a way to analyze the real estate market yourself. You probably heard that the real estate market only goes up and that it is always a good investment.
This is a fact that will be repeated by every estate agent on the planet.
The reason is simple, the real estate agents wants you to buy quickly because they make their living with the commission you pay.
Did you know that most real estate agents in the United states work part time? Most new real estate agents are working part-time and they are not making a lot of money.
They are not making a lot of money because to make money they need to make sales and to make sales they need to have experience which only comes with time.
After spending a few years building relationships with local residents, marketing themselves and learning the ins and outs of the real estate market, they can start making a living.
Unfortunately, most new agents do not make it because they do not have the skills to sell houses. According to this article, 87% of all real estate agents fail in their first 5 years.
Based on this information, it could be argued then that if you are dealing with a real estate agent while a recession is happening, and that this particular agent has been working full time for 5 years or more, then this person is actually good at what they do.
Think about it for a second, somebody who becomes an agent just for the easy money will not stick with this profession if the headwinds become too strong and if they are not in it for the long term.
If they had not what it takes to make it in a bad market they would either go back to their previous career or they would go into another profession.
So as we circle back to this supposed fact that the real estate market only goes up, the question you need to ask yourself is, do you trust your agent when they tell you that the real estate market is hot when their income depends on you buying a property?
How to analyze the real estate market with Zillow Data Exporter
Fortunately for you there are many ways to analyze the real estate market and one of them is to use Zillow Data Exporter.
Lets take a look at the data for the town of Sarasota, Florida.
Follow along if you are interested in learning how to analyze the real estate market with Zillow Data Exporter.
Step 1: Install Zillow Data Exporter
Go to the Chrome store and install Zillow Data Exporter. If you are not familiar with it, Zillow Data Exporter is a free Chrome extension that allows you to export data from Zillow.
You can export the data to a CSV file or an Excel file and then you can import it in your favorite spreadsheet software.
I recommend Google Sheets because it is free and it is easy to use.
Step 2: Search for properties in Sarasota, Florida
Go to Zillow and search for properties in Sarasota, Florida for example. Use the filters to narrow down your search to the properties that you are targeting.
For this example, we will be looking at single family homes that are for sale for a price between $300,000 and $400,000.
Feel free to use your own filters and search criteria if the ones I am using do not match your needs.
Once you have found the properties that you are interested in, click on the Zillow Data Exporter icon in your browser and choose your export format.
In this instance I selected CSV.
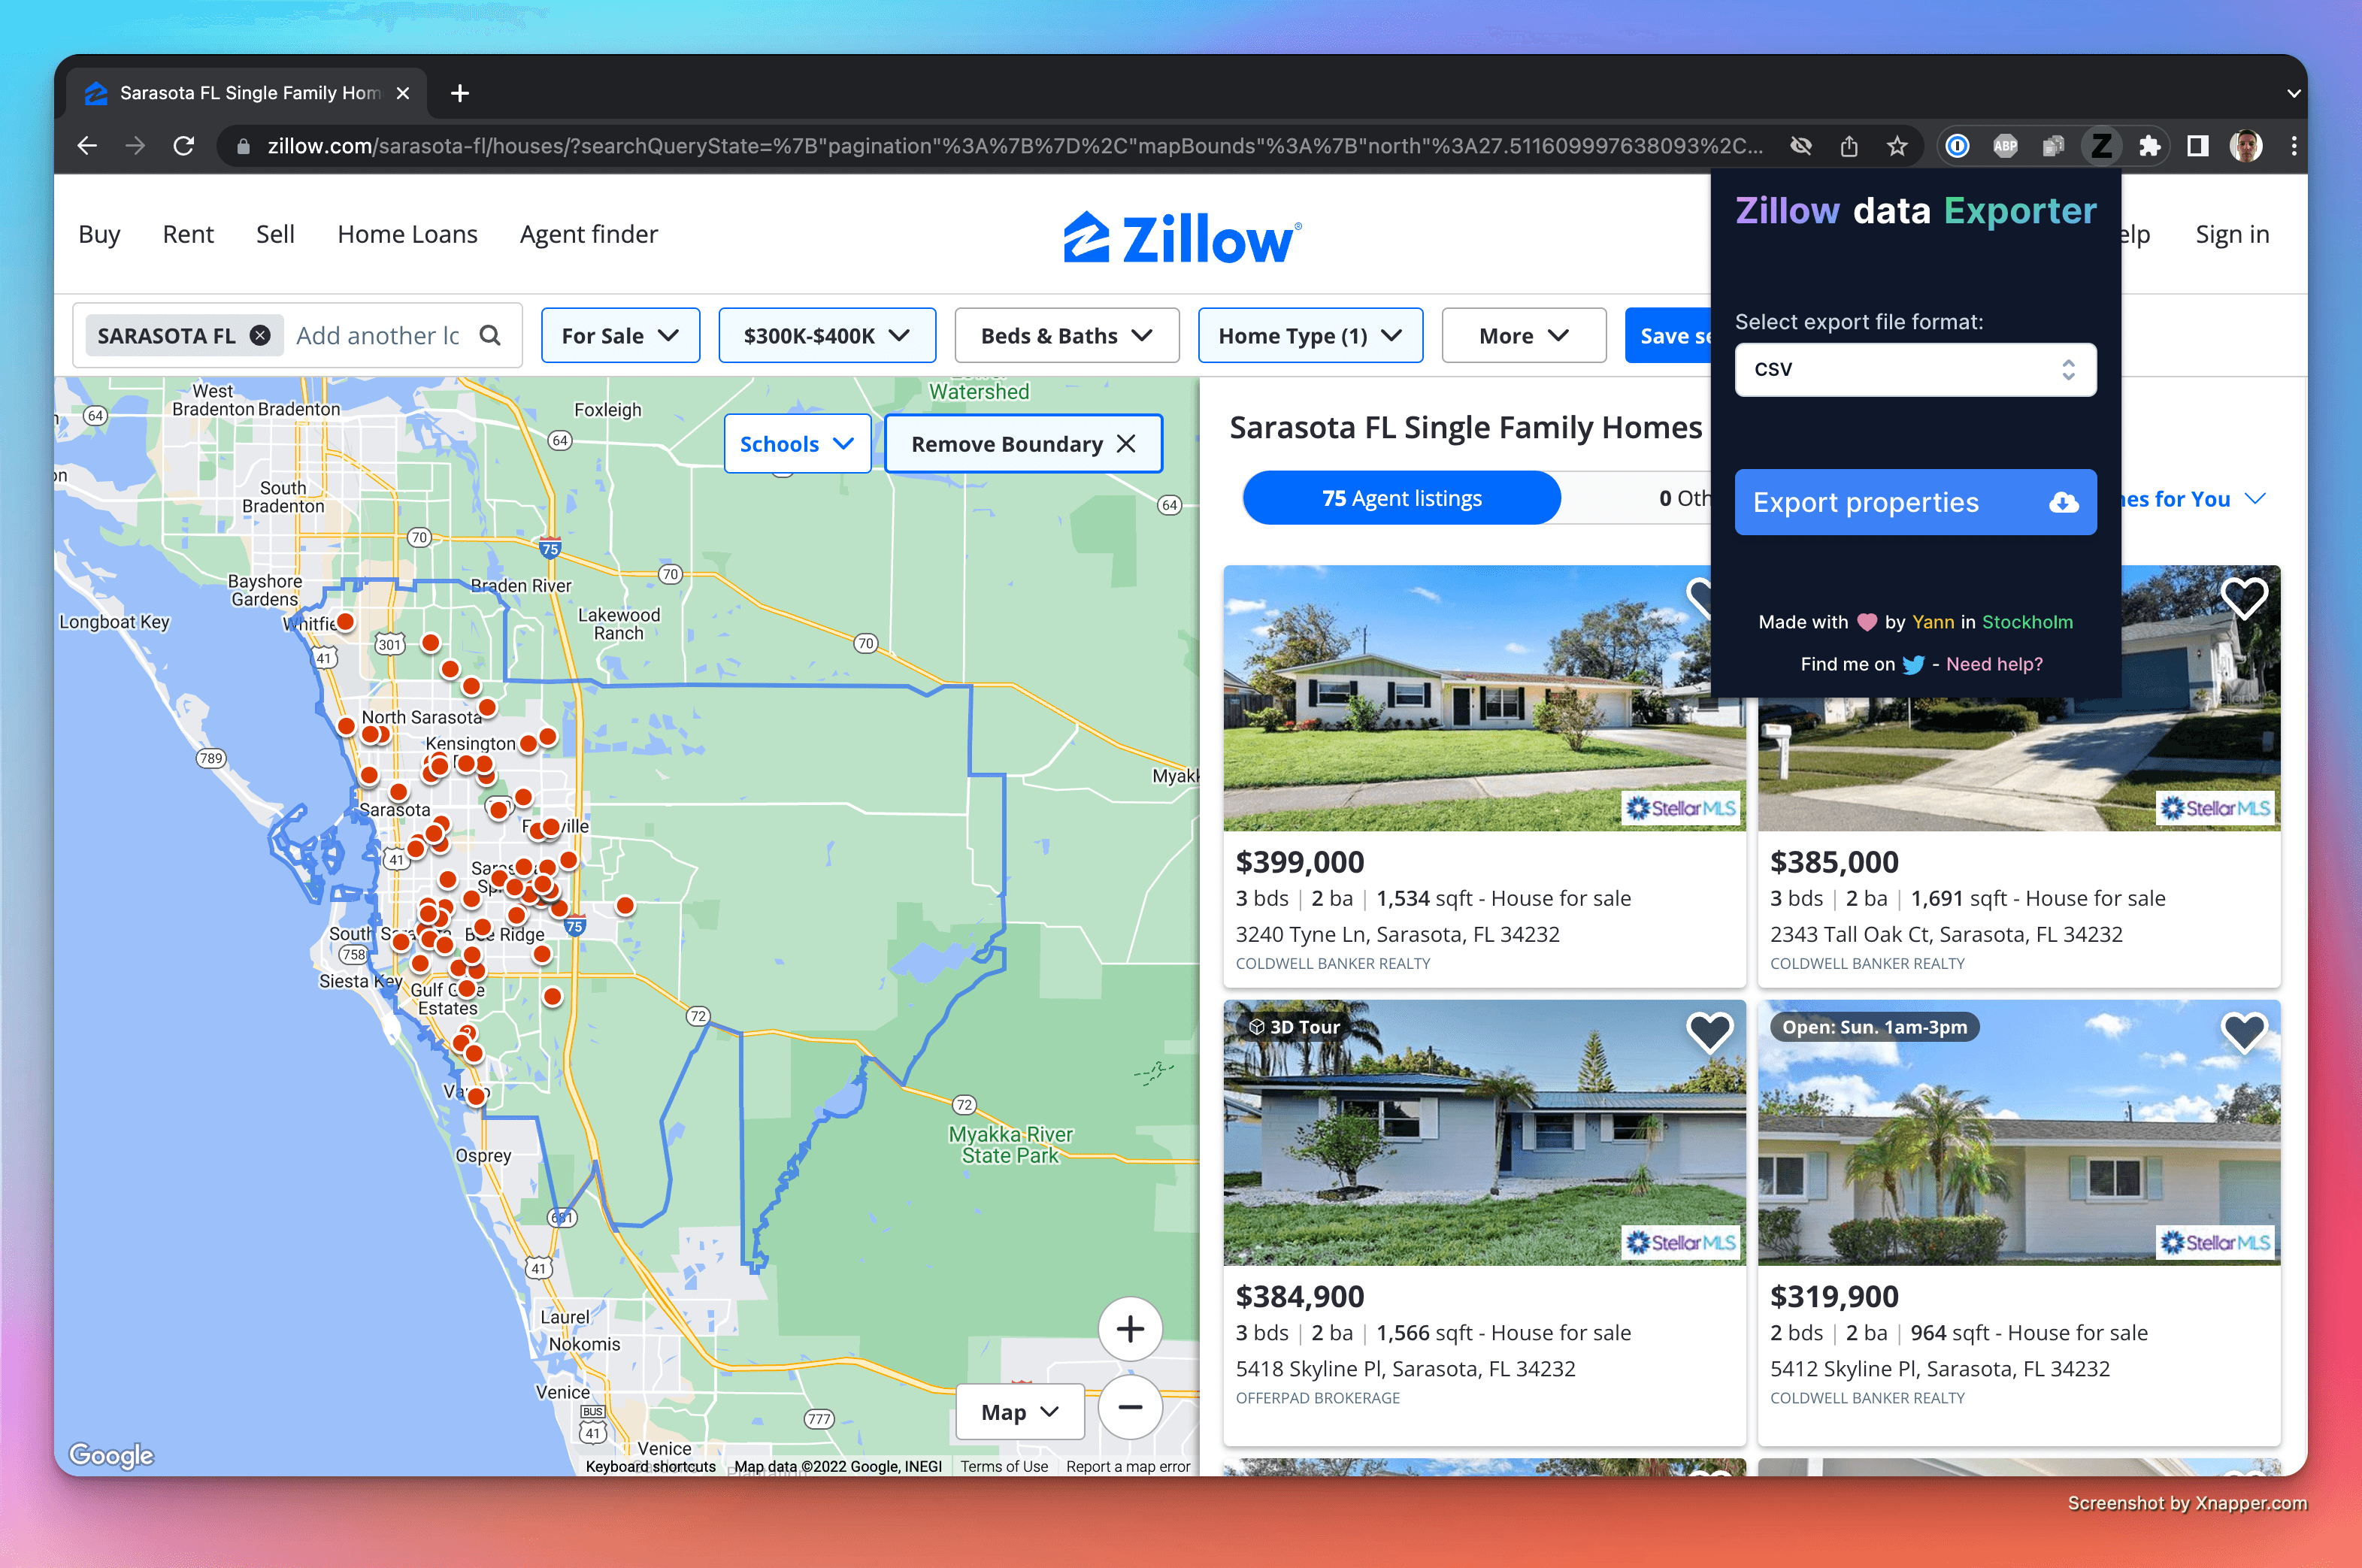
Click the "Export properties" button.
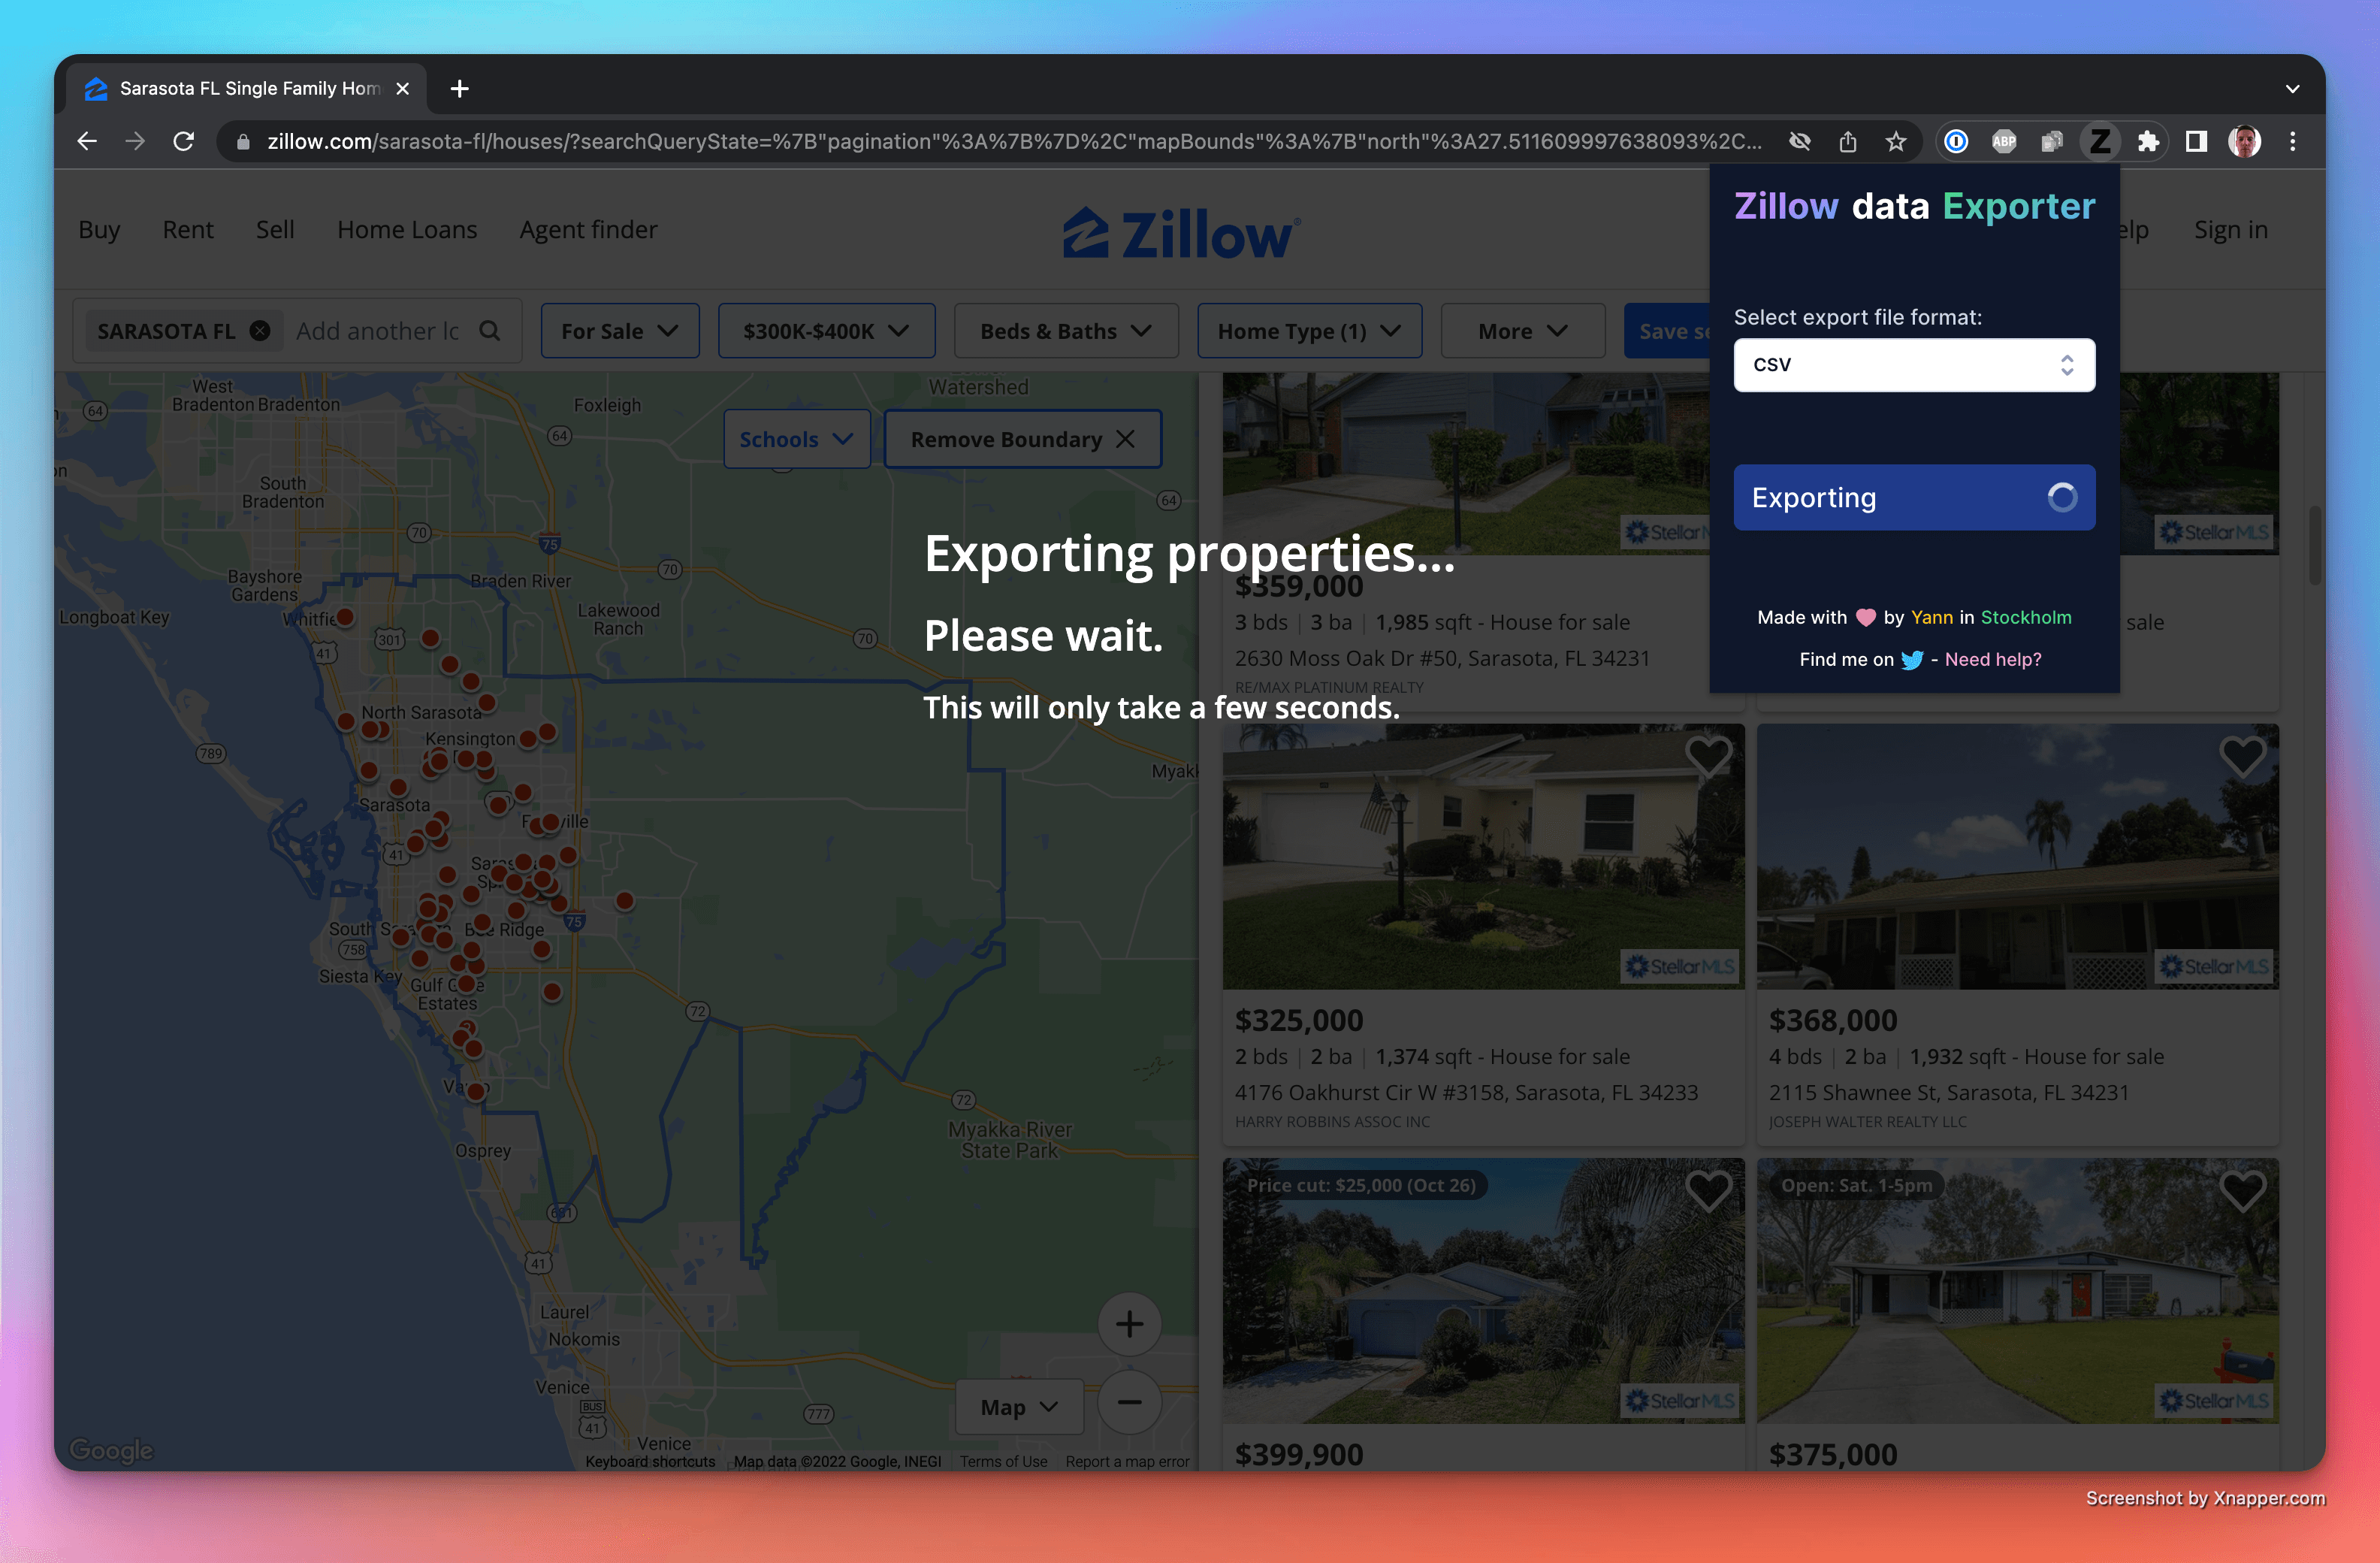
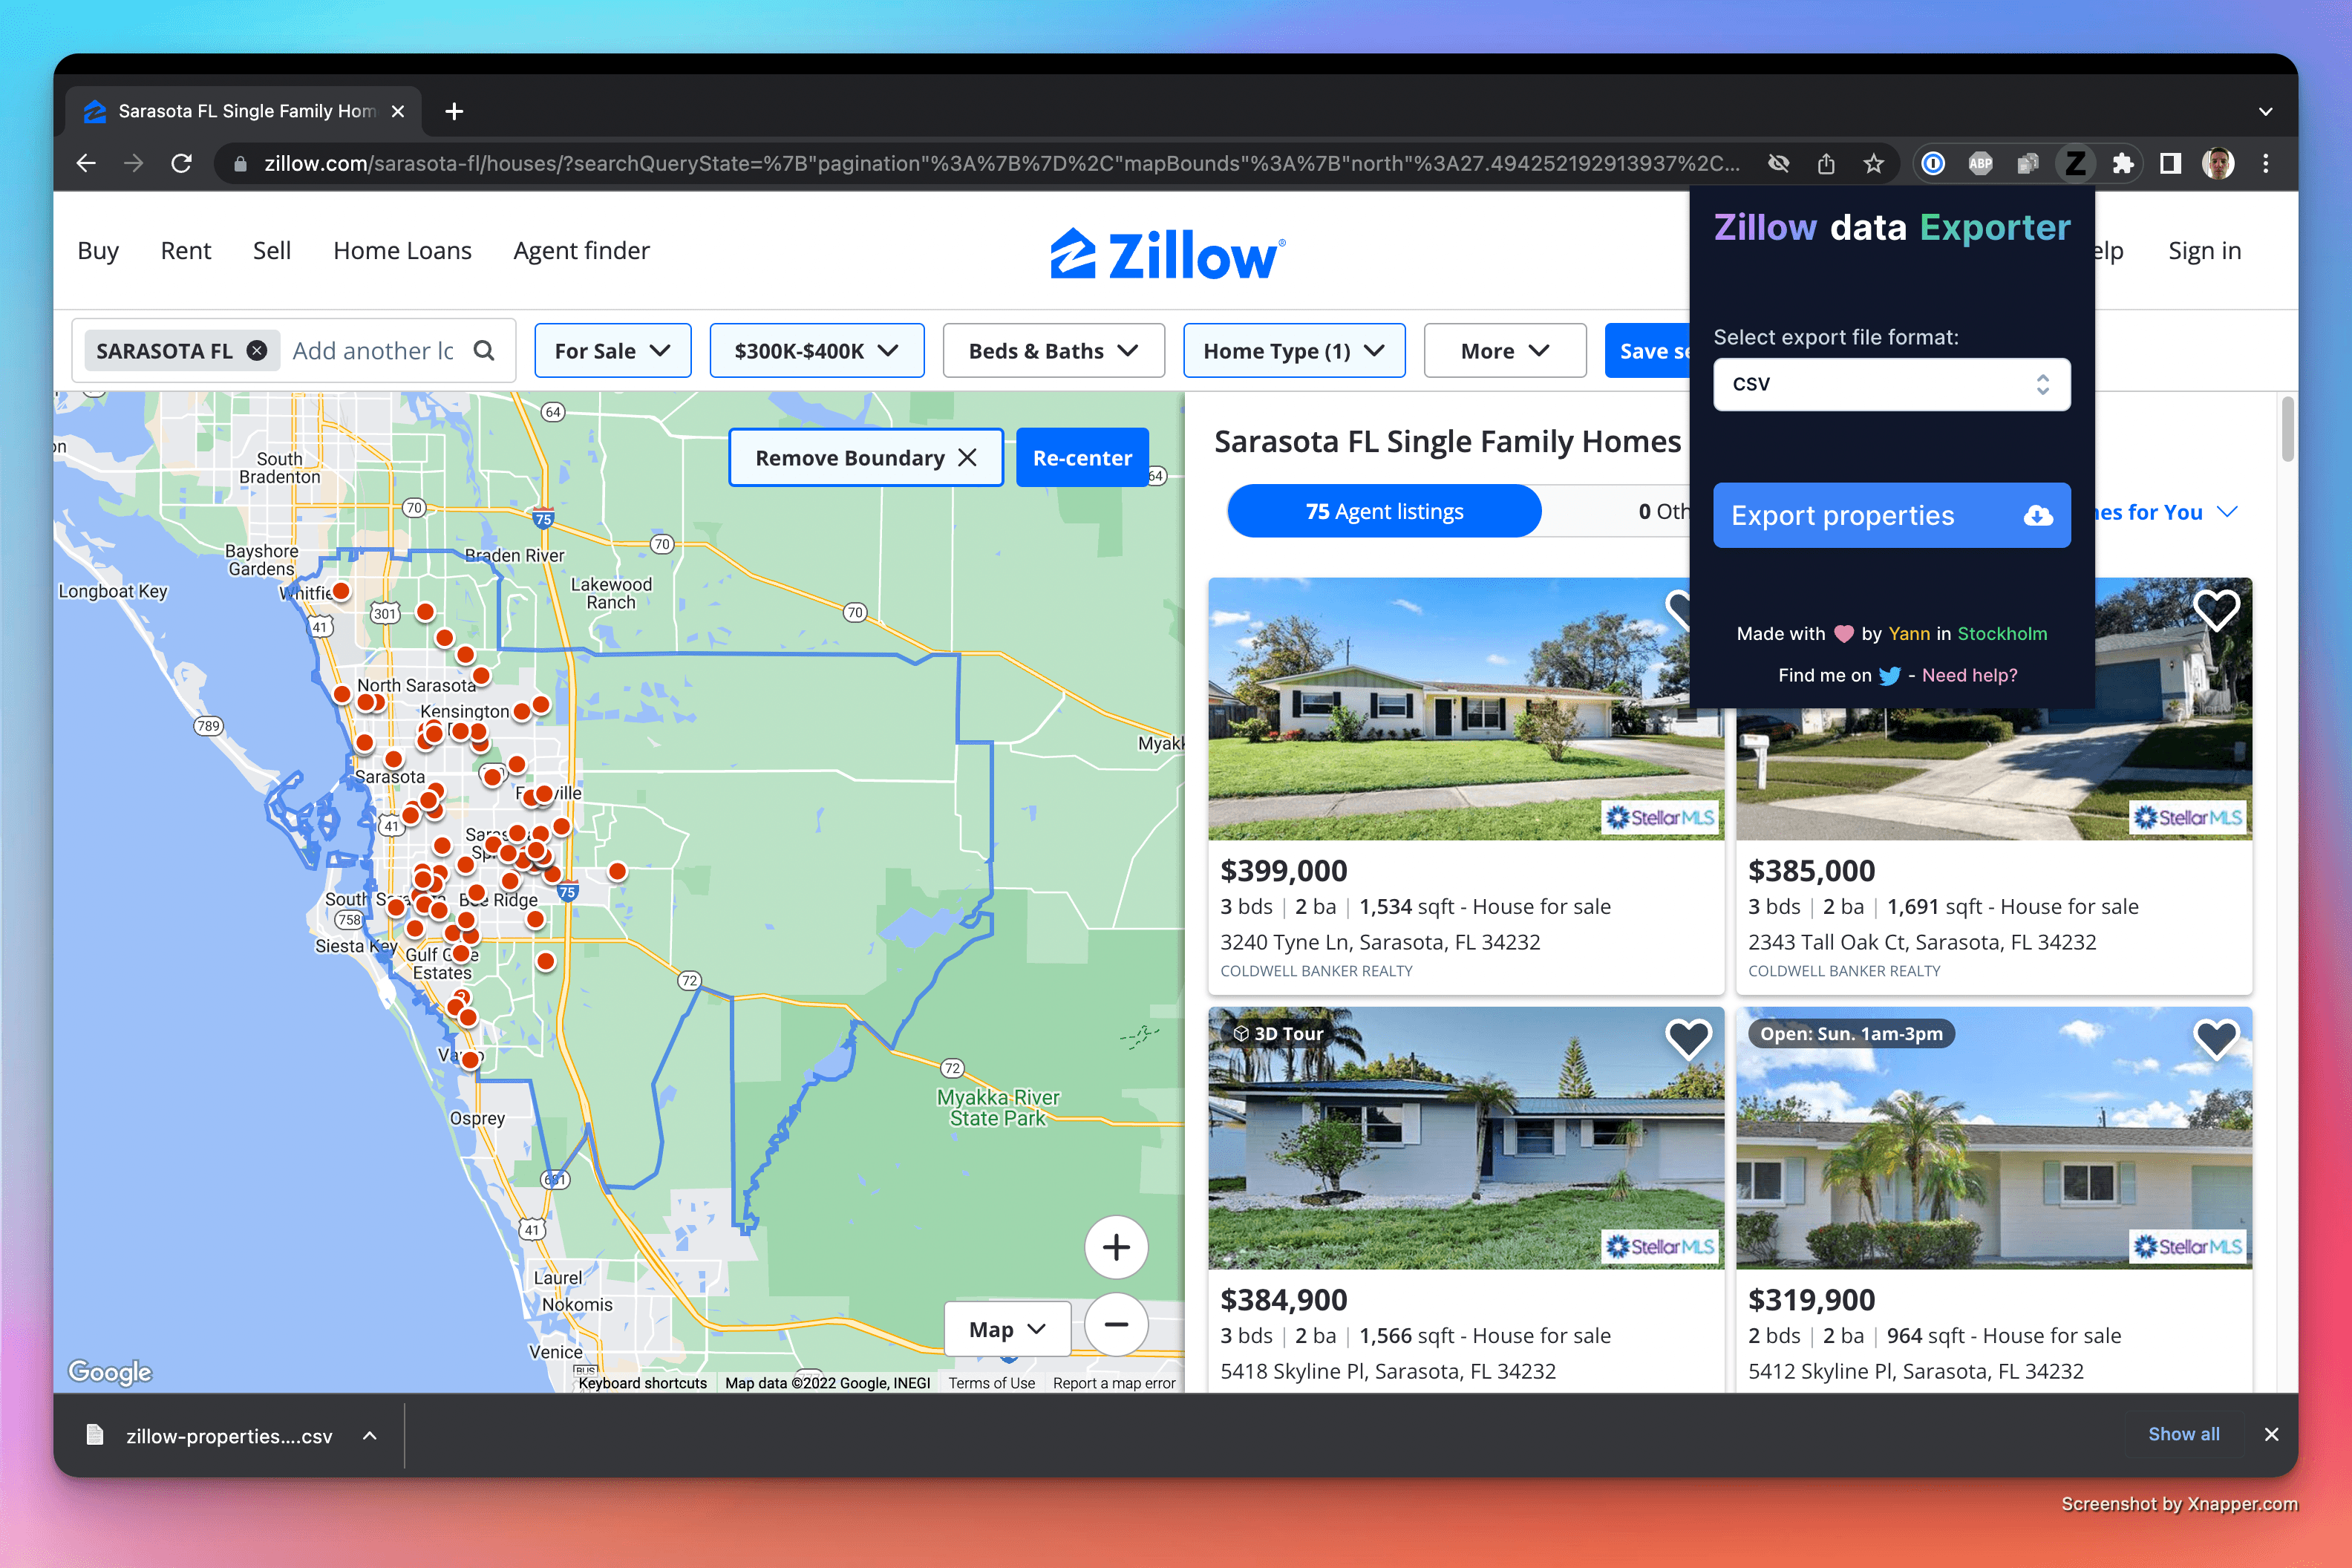
The data should be exported to a CSV file that is downloaded automatically to your computer.
Step 3: Calculate the average price cut amount
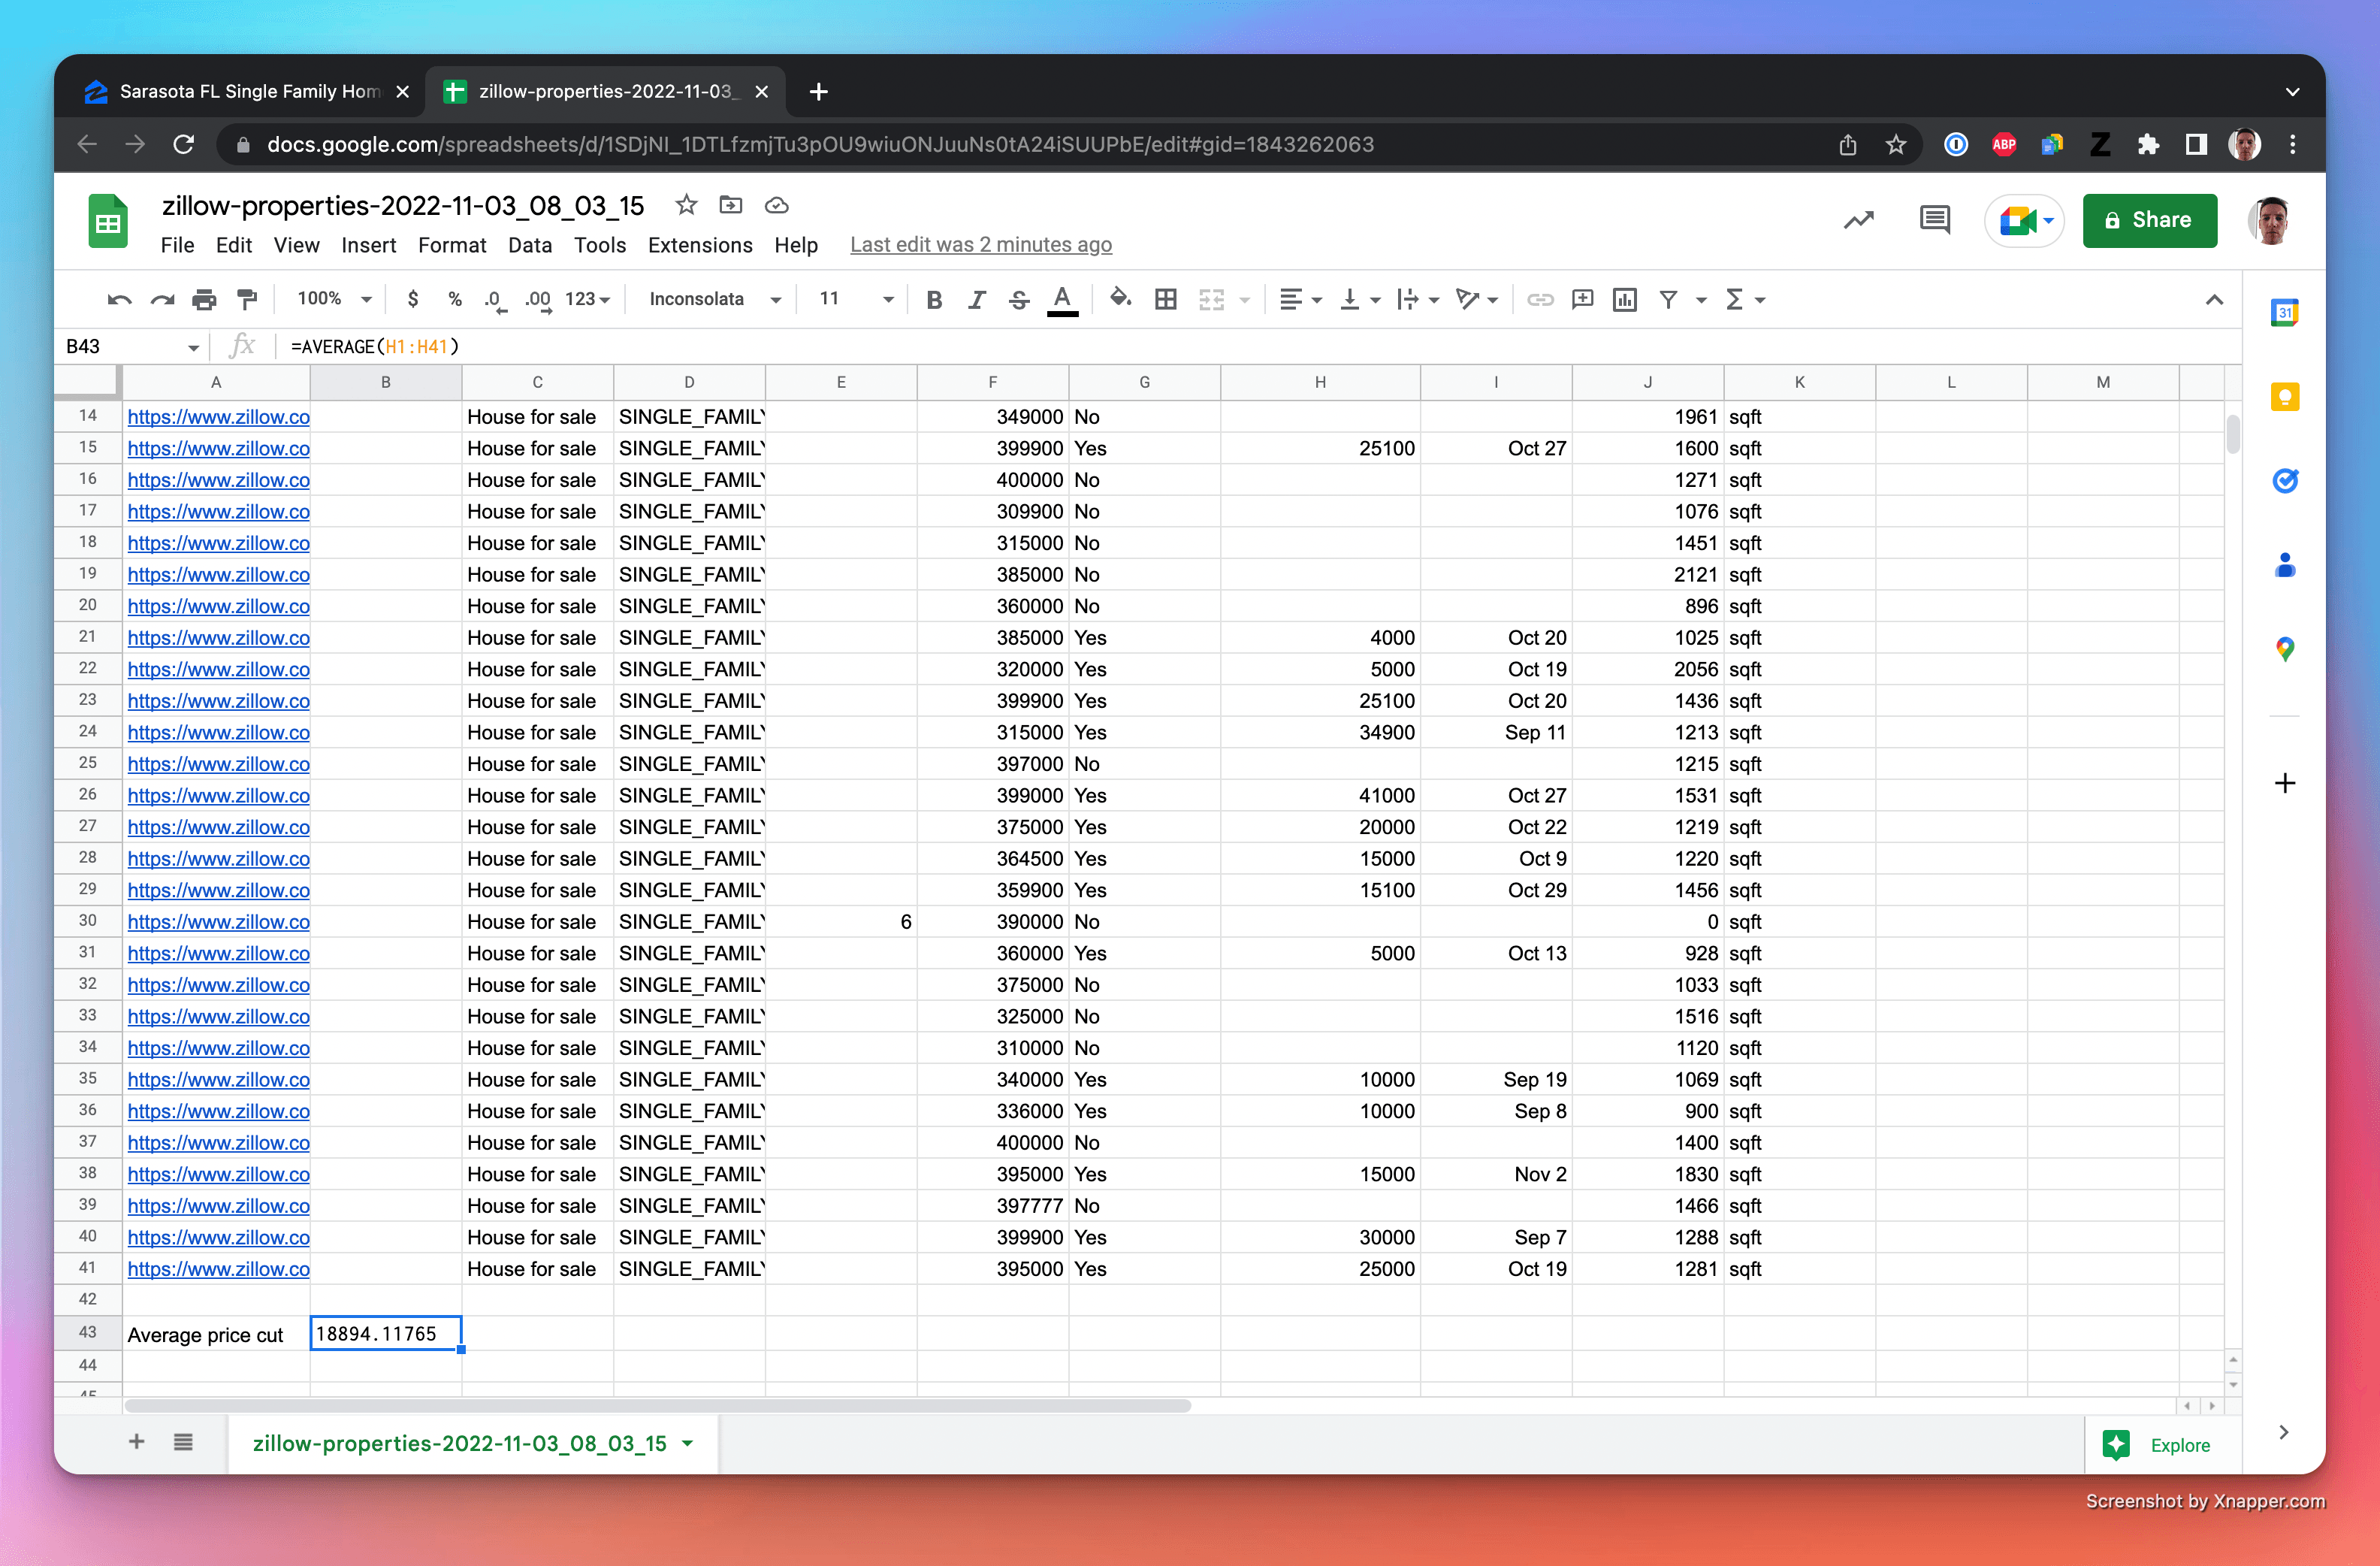
Open the file in Google Sheets and you should see something like this:
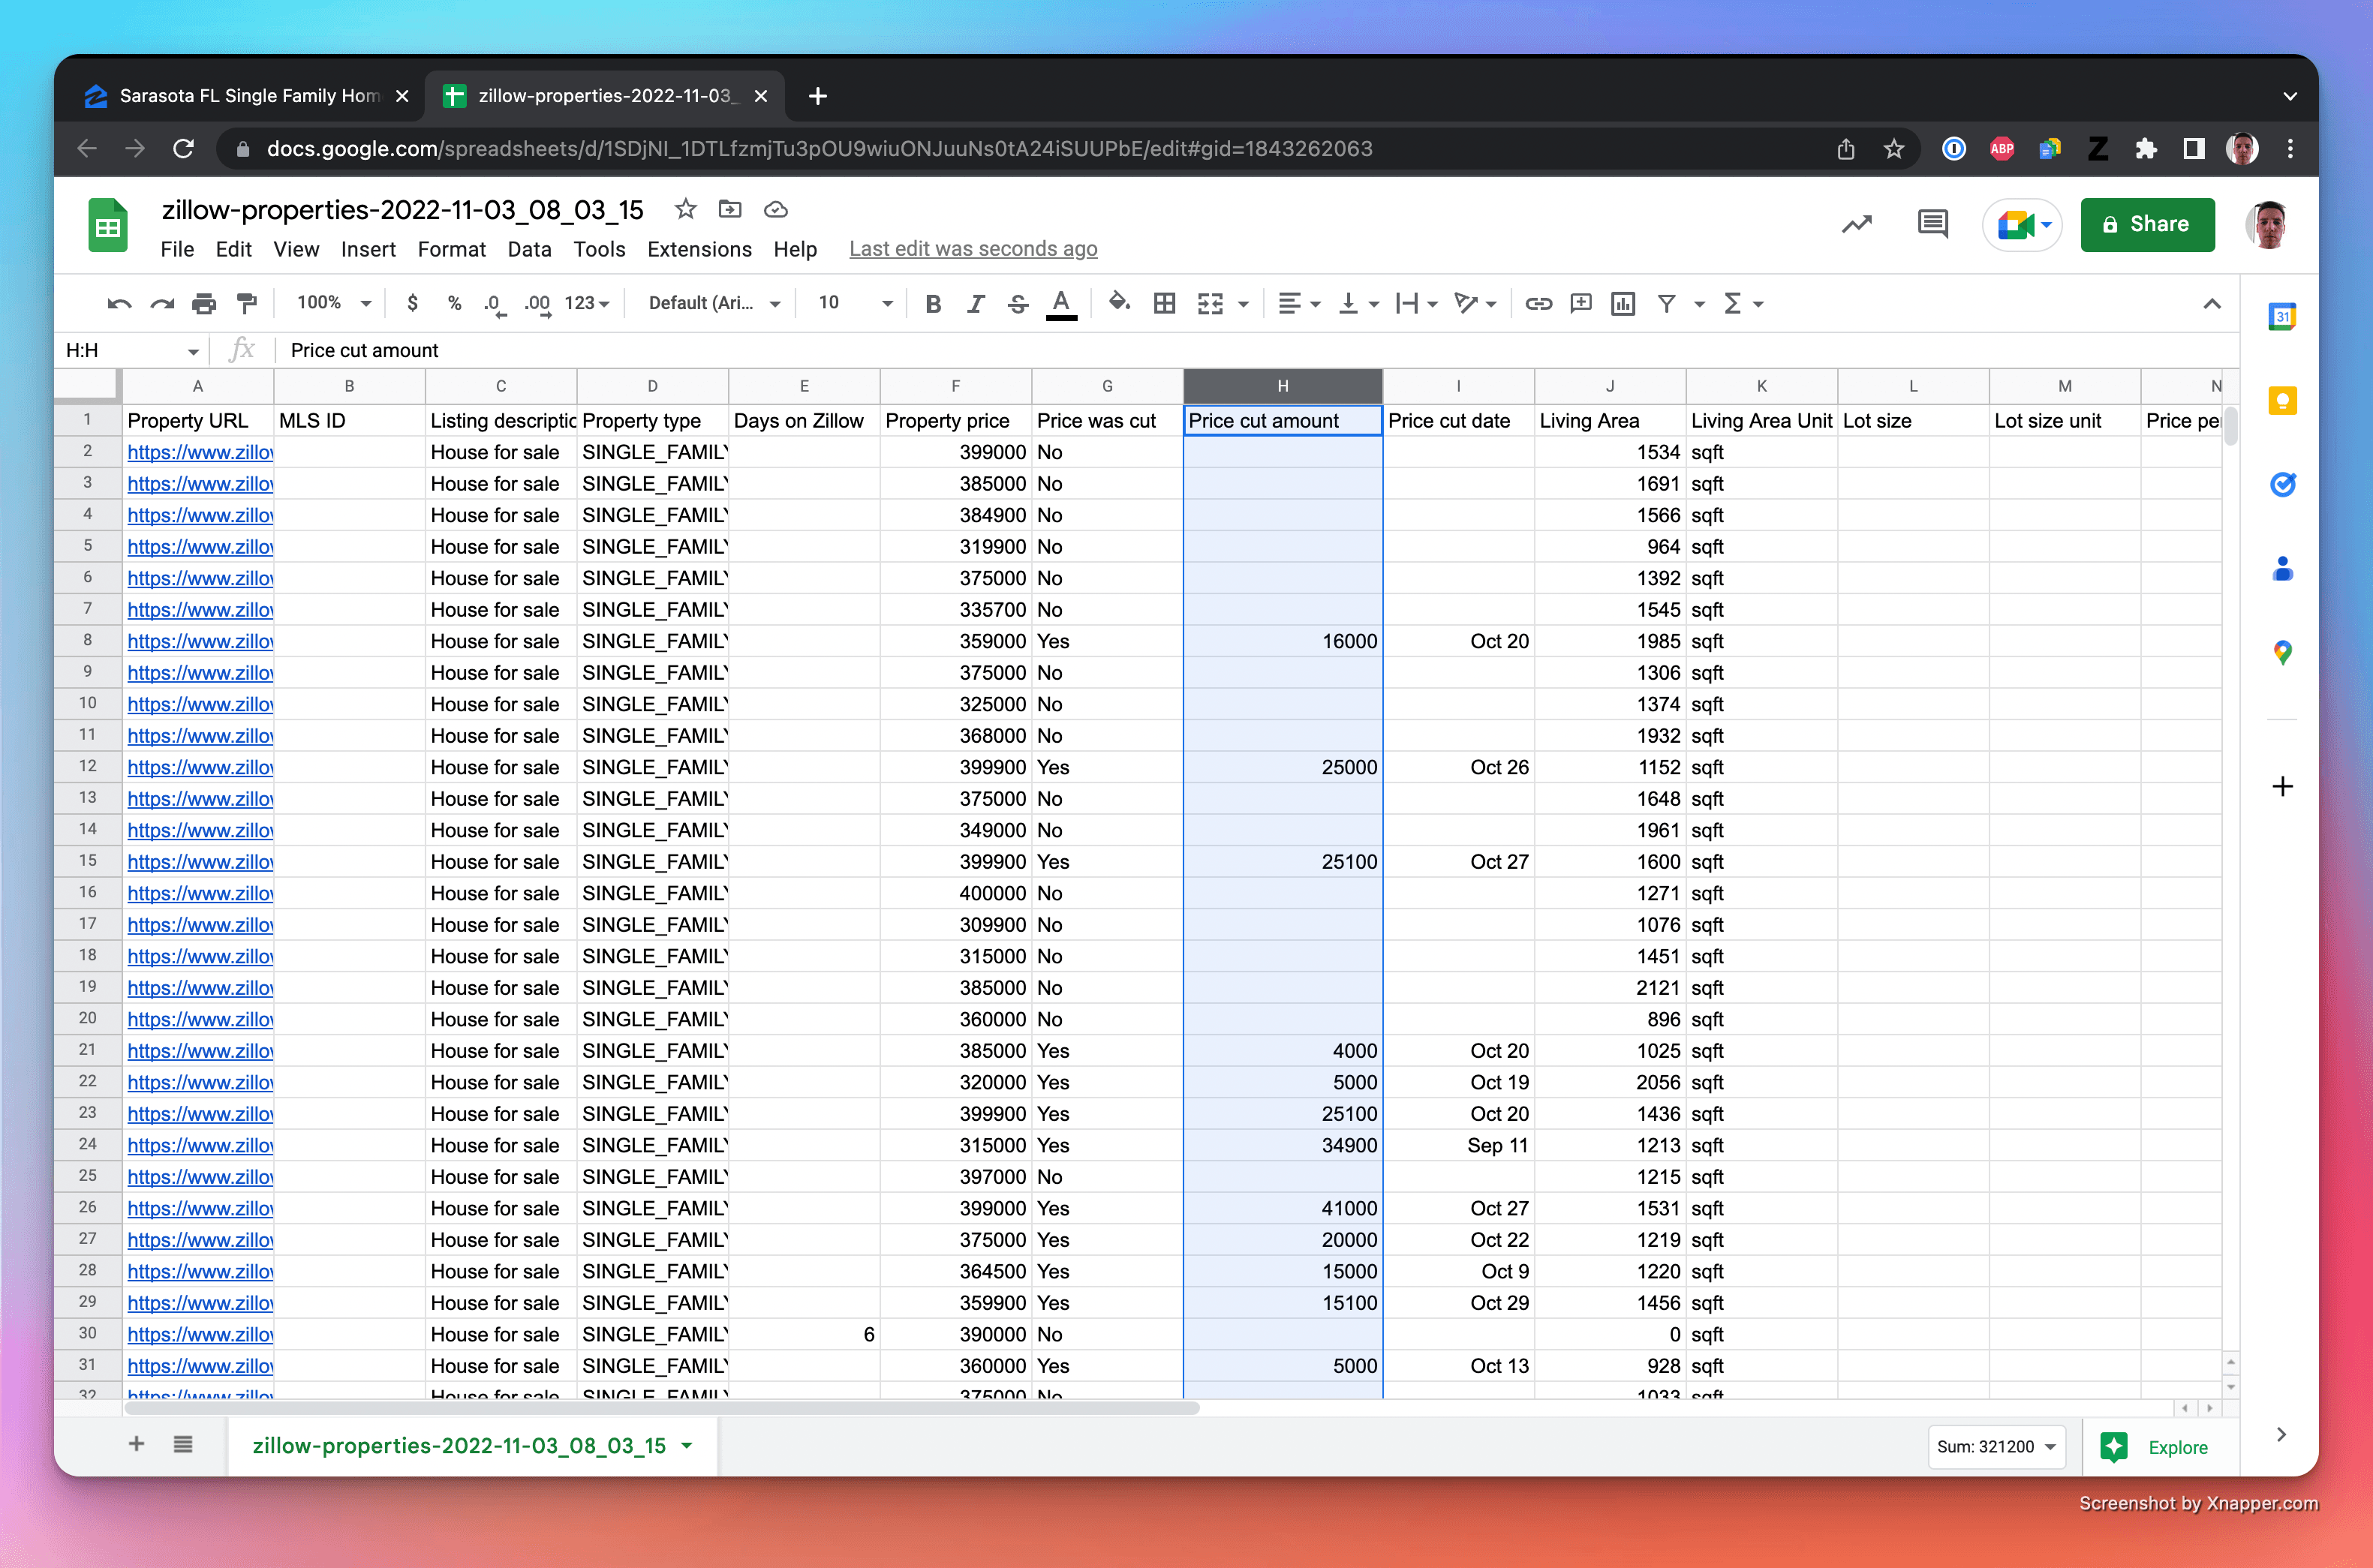
The column we are looking for is the price cut amount column.
I am sure you can see the trend here, the price cut amount tells you how much the price of the property was cut and the price cut date tells you when the price was last cut.
Calculate the average price cut amount by using this formula:
=AVERAGE(H1:H41) where H1:H41 is the range of cells that contain the price cut amount.
This formula simply takes all the amounts in the price cut amount column and calculates the average.
It ignores the first row because it is the header row. It also ignores the empty cells in the column because they are not valid numbers.
The result obtained gives you a quick overview of the state of the real estate market.
In our case the result obtained is roughly $18894.12.
Step 4: Calculate the percentage of home whose price was cut
The next step is to calculate the percentage of homes whose price was cut.
To do this, we will use the following formula:
=COUNTIF(H1:H41,">0")/40 * 100
This formula counts the number of cells in the price cut amount column that are greater than 0 and then divides that number by the total number of cells in the column and then multiplies the result by 100.
In our case the result is 42.5% which means that 42.5% of the homes in this search result have had their price cut.

Step 4: Deduct the state of the market
If you can see many price cuts and the price cut date is recent then you can assume that the market is not doing well.
If we see that the last price cut was a while ago, then maybe things have stabilized and the market is doing better. The interpretation is up to you but the data is there for you to make your own conclusions.
Step 5: Repeat the process
You can repeat this process every week, every month or every quarter to see how the market is doing.
By comparing the data from one period to another you can see if the market is improving or if it is getting worse.
Conclusion
You have now learned how to do a basic analysis of the real estate market with Zillow Data Exporter.
You should remember that there is not a single real estate market.
Each town, each suburb is different and the conclusions you reach regarding a particular suburb may be completely different from the conclusions you would reach regarding another suburb located a few miles away.
In any case, you can now form your own opinion regarding the market and you do not have to rely on someones else opinion, especially if the opinion of the person you are relying on is potentially biased.

